The Component in the Middle: What Your Cloud Architecture Diagram Isn’t Telling You
A thought experiment on how a single central layer can quietly become your biggest operational blind spot.
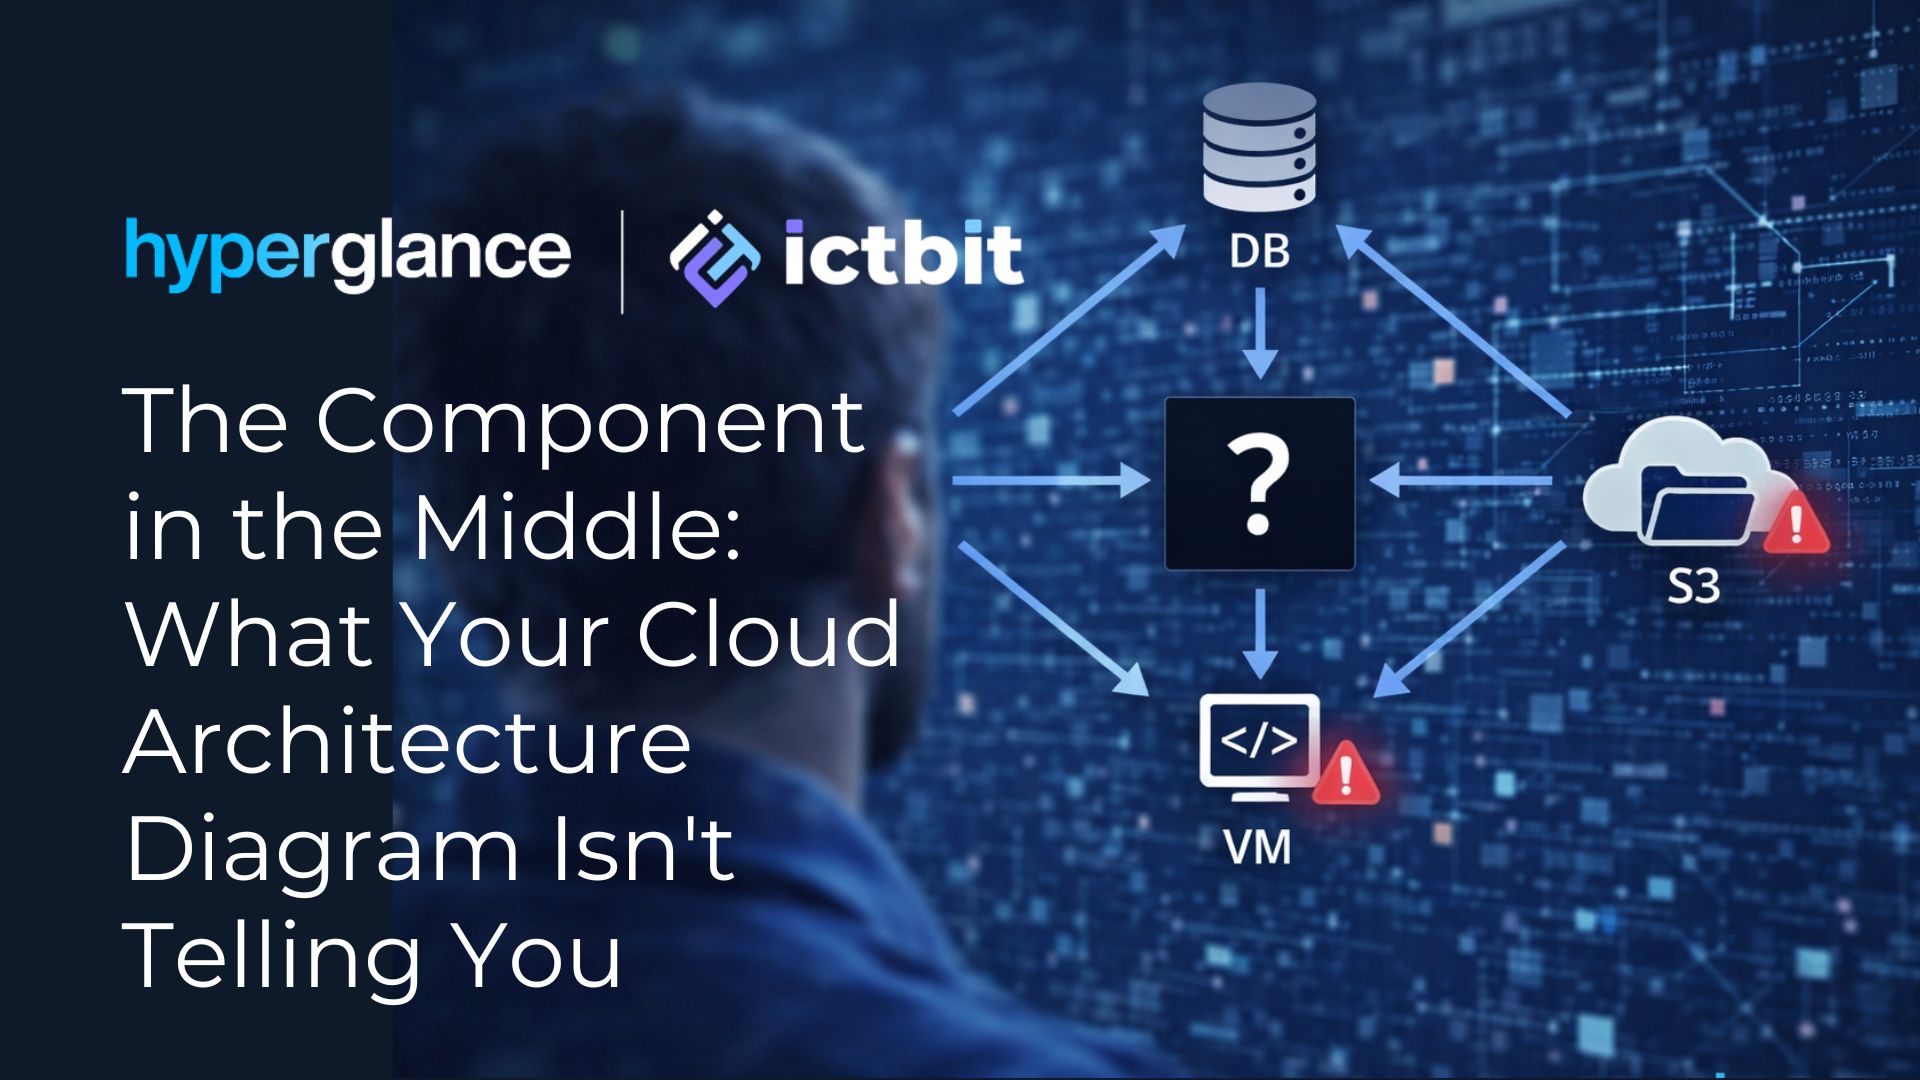
Take a look at the architecture diagram above. It shows a familiar pattern: compute, storage, a database – and one central component sitting in the middle, tying everything together. Clean. Simple. Readable.
Now ask yourself: how closely does this kind of diagram reflect what’s actually running in your production environment right now?
For most teams, the honest answer is: less accurately than it used to.
What the middle layer becomes over time
In theory, that central component is just a connector. A routing layer, an API gateway, a message broker, a service mesh – whatever form it takes, its job is to facilitate communication between the other parts of the system.
In practice, it often becomes something much more significant.
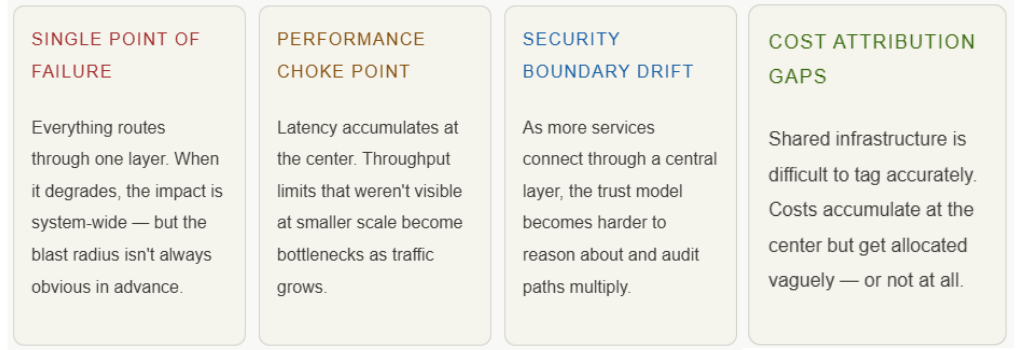
“What started as a simple architectural layer can easily turn into a single point of failure, a performance choke point, a critical security boundary, or a blind spot when you’re trying to understand ownership, usage, and cost.”
Traffic converges there. Dependencies accumulate. New integrations get attached. Over months and years of organic growth, the central component evolves — not through a deliberate architectural decision, but through the natural accumulation of changes, each of which made sense at the time.
Four risks hiding in plain sight
The challenge isn’t that this evolution happens. It’s that it tends to be invisible until something forces you to look closely. Here are the four failure modes we see most often:
The gap between design and production
This isn’t a story about bad architecture. It’s a story about the nature of complex systems. Cloud environments don’t stay static – they evolve continuously. New services get added. Integrations multiply. Teams change. Documentation drifts.
The result is a growing gap between how the architecture is understood – based on diagrams, runbooks, and institutional memory – and how it actually behaves in production. That gap is where incidents begin, where costs become hard to explain, and where optimization efforts stall.
Understanding what sits in the middle of your architecture, and what it’s actually connected to, is increasingly the foundation of effective cloud operations – not a nice-to-have, but a prerequisite for making good decisions about reliability, efficiency, and spend.
Why we added Hyperglance to our portfolio
This is precisely the problem that motivated our partnership with Hyperglance. The platform gives cloud and platform engineering teams a live, accurate map of their environments – showing how resources are connected, which services depend on which components, and where cost and ownership are unclear.
It doesn’t replace architectural thinking. But it makes the gap between design and reality visible – which is the first step toward closing it.
Through this partnership, ICTBIT customers can bring greater clarity to their cloud environments: faster incident diagnosis, better cost attribution, more confident optimization decisions, and clearer ownership across teams.
We’d like to hear from you
Looking at the architecture diagram at the top of this post – what component would you expect to sit in the middle of that system? Let us know what you’re seeing in your own environments.
Interested in mapping your cloud environment?
Reach out to the ICTBIT team to learn how Hyperglance can give your organization a clearer picture of how your cloud is actually structured – and help your platform and FinOps teams make better decisions.